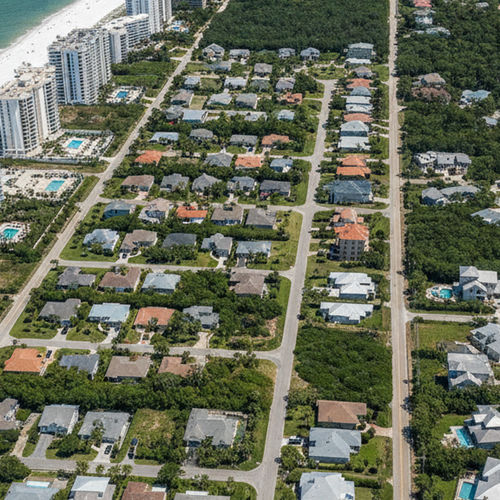

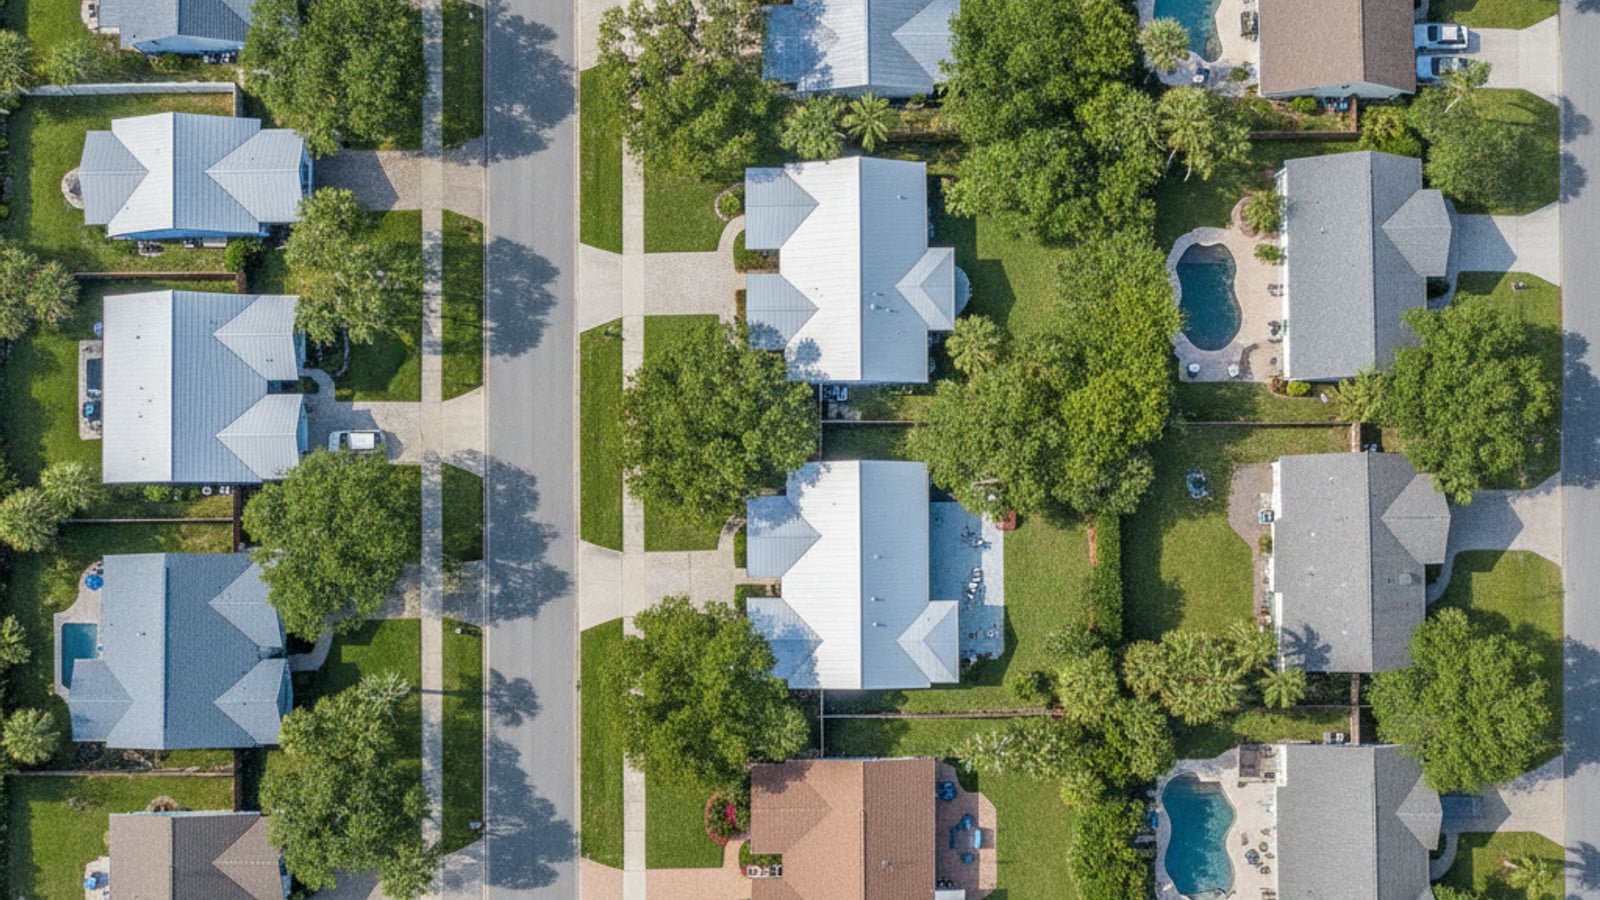
The median home sale price in Panama City Beach, FL is around $380,000, and buyers looking at the 857 properties currently on the market almost always ask about the weather. That's a smart instinct. For anyone living in Panama City Beach, the Gulf Coast climate shapes more than your weekend plans - it directly influences utility bills, insurance costs, and what you'll spend keeping a home's exterior in decent condition year after year.
Homes here sit on the market a median of roughly 101 days, so you have time to think this through carefully. Use it. Knowing what the coastal weather actually demands before you put in an offer will save you from some expensive surprises.
A Quick Look at the Panama City Beach Climate
Panama City Beach carries a Humid Subtropical climate, categorized under the Köppen system as Cfa - no dry season, hot summers. That's the official shorthand. What it means in practice is long, warm summers, short mild winters, and Gulf moisture hanging in the air for most of the year. That moisture isn't just uncomfortable; it shapes how homes here are built and what they need to stay in good shape.
The Local Climate Zone
The Humid Subtropical designation plays out across the entire Florida Panhandle. Because there's no defined dry season, rain can show up in any month, and the vegetation stays green year-round as a result.
The Gulf itself acts as a temperature buffer for the immediate coast. Inland areas swing more sharply between morning and afternoon temperatures. Right along the water, conditions stay comparatively stable throughout the day.
Season-by-Season Weather Conditions
The seasonal shifts here are real, just not what buyers from the Northeast or Midwest expect. There's no snow to signal the change of seasons. Instead, you're reading humidity levels, ocean breeze patterns, and the length of the afternoon thunderstorm window.
July and August are the hottest months, with average highs reaching about 88.3°F (31.3°C). That's the top of the range. The bottom comes in January, and even that is relatively tame by most standards.
Summer Heat and Humidity
Heat and moisture are the dominant facts of life from June through September. Daily highs push routinely into the upper 80s and low 90s. August specifically averages a high of 88.3°F and a low of 78.4°F - which means even overnight, the air conditioner doesn't get a break.
Afternoon thunderstorms are a regular part of the summer routine, not an event. They roll through, drop heavy rain for a stretch, briefly cool things off, and then the sun comes back.
Mild Coastal Winters
January is the coldest month. Average high lands at 60.1°F (15.6°C), with overnight lows around 47.7°F (8.7°C). Freezing temperatures along the immediate shoreline are uncommon. Most residents spend winter evenings outdoors without anything heavier than a light jacket.
Spring and Fall Shoulder Seasons
March warms to average highs around 68.9°F and lows near 56.1°F - comfortable enough that it's become a popular time for buyers to tour homes without sweating through the process.
Fall mirrors that comfort almost exactly. November's averages are 68.9°F for the high and 54.9°F for the low. These two shoulder seasons are genuinely the most pleasant stretches of the year for spending time outside.
Monthly Temperature Averages
The annual temperature spread runs from a January low around 47.7°F to an August high around 88.3°F. That range matters for budgeting - it tells you roughly how hard your HVAC system will work at both ends of the calendar.
The highs rarely crack 100°F, but the heat index makes the air feel significantly warmer than the thermometer reads. The Gulf breeze helps during the hottest parts of the afternoon, though it's not a substitute for a well-functioning air conditioner.
The Hottest and Coldest Months
August is the peak. Highs of 88.3°F and overnight lows that only drop to 78.4°F mean air conditioning runs continuously. Budget accordingly when you're looking at utility costs.
January is the opposite end. Highs average 60.1°F and lows settle at 47.7°F - the one stretch of the year when you might actually turn on the heat.
Month-by-Month Temperature Breakdown
February begins a gradual warmup, averaging a high of 63.5°F and a low of 51.3°F. By March, those numbers climb to 68.9°F and 56.1°F respectively.
Coming back down, November returns to a 68.9°F high and a 54.9°F low. December closes the year at 63.5°F for the high and 51.8°F for the low.
Precipitation and Humidity Levels
Panama City Beach gets roughly 35.8 to 60 inches of rain per year, depending on the tracking station and data source. August is consistently the wettest month, typically seeing around 5 to 7.4 inches of rainfall. May and February tend to be the driest months.
That steady rainfall throughout the rest of the year feeds the dense coastal landscape - and it makes drainage a practical concern for any property you're seriously considering.
Average Annual Rainfall
The national average sits at about 38 inches, so Panama City Beach runs well above the norm by most measures. Some sources record up to 166 rainy days annually totaling roughly 35.83 inches; others measure closer to 55 or 60 inches. The difference often comes down to methodology and station location.
What's consistent is the character of the rain - quick and intense, not day-long drizzles. Proper lot grading and well-maintained gutters aren't optional here; they're part of owning a home in this environment.
Year-Round Humidity Expectations
Relative humidity stays in a fairly tight band year-round, typically ranging from 72% to 77%. October is usually the least humid month at about 71%. December is the most humid at 77%.
That consistent moisture means your air conditioning system is pulling double duty - cooling the air and dehumidifying it. When you're touring homes, pay close attention to the age and condition of the HVAC unit. It works harder here than in most markets.
Snowfall on the Gulf Coast
Snow averages about 0.2 days per year. Historically, only January and March record any snow at all, at roughly 0.1 days each.
The exception worth knowing about: on January 21, 2025, a rare winter storm dropped about 3 inches of snow in downtown Panama City. Inland areas of Bay County saw up to 6 inches - the most significant snowfall the area had seen since 1989.
Hurricanes and Storm Risks
The Atlantic hurricane season runs June 1 through November 30, with September typically carrying the highest probability of hurricane activity. For a Gulf Coast community, that's not an abstract statistic - it's a real factor in what you'll pay for insurance and what you'll need to do to protect a property.
Storm surge is the single deadliest hurricane hazard, responsible for nearly 90% of hurricane-related deaths. The region also deals with tornadoes spawned by hurricanes and dangerous rip currents along the beaches.
Tracking Hurricanes and High Winds
Hurricane Michael remains the defining storm for this area. It made landfall just east of the city in Mexico Beach in October 2018 as a Category 5 hurricane - one of the strongest ever to hit the continental U.S.
Other storms that have touched this stretch of coast include Hurricane Eloise in 1975, Hurricane Opal in 1995, Hurricane Ivan in 2004, Hurricane Dennis in 2005, and Hurricane Helene in 2024. Helene came ashore well east of the city but still produced higher waves and localized flooding here.
Historical Wind Events
Risk modeling from First Street indicates the area has historically recorded 154 wind events. The most severe on record was a Category 4 hurricane in 1929 that brought sustained winds up to 155 mph.
Current modeling estimates that an extremely rare 1-in-3,000-year storm event could produce wind gusts up to 180 mph today. Local building codes require impact-resistant windows and reinforced roof tie-downs to address that risk.
Buying a Home in This Climate
The average sale-to-list price ratio here sits at about 95.6%, which gives buyers some room to negotiate - particularly on properties that need weather-related updates. And plenty of them do.
The combination of sustained heat and coastal salt air is hard on exterior surfaces. When you're touring homes, look closely at the siding, the outdoor HVAC compressors, and the roofing materials. These are the places the climate shows up first.
Factoring Weather Into Your Decision
A property with mature trees offers real shade value during the summer months when highs are running at 88.3°F. That said, those same trees need regular trimming to limit the wind damage risk during hurricane season - it's not a one-time consideration.
Drainage is the other thing to check carefully during any tour. With up to 60 inches of rain annually possible, water needs a clear path away from the foundation. Lot grading isn't glamorous, but it matters.
Current Local Housing Market
With 857 homes currently for sale, you have enough options to compare construction styles and vintages side by side. Newer homes are built to stricter wind codes; older homes may need retrofitting to qualify for lower insurance premiums.
Sellers frequently highlight recent storm-proofing upgrades - impact windows and newer roofs show up often in listing descriptions, and for good reason. In this coastal market, those upgrades genuinely affect how quickly a home moves.
Frequently Asked Questions
How do hurricane seasons and weather patterns in Panama City Beach affect local homeowners insurance costs?
The significant hurricane risk here directly drives insurance premiums. Carriers have priced in the history of major storms - Hurricane Michael in 2018, Hurricane Helene in 2024 - and they account for both wind and storm surge exposure. Get insurance quotes early in your purchase process, before you're under contract and on a clock.
What happens if a named storm approaches Panama City Beach, FL while my home purchase is under contract?
Insurance companies issue binding restrictions when a named storm enters a specific geographic box in the Gulf. That means you can't secure a new hazard or wind policy until the storm passes. If that delay pushes your closing date, most standard real estate contracts include a force majeure clause to extend the timeline.
What specific weather-proofing features should buyers look for when touring homes in Panama City Beach?
Impact-resistant windows and reinforced roof tie-downs are the primary items to confirm. Because the area averages 35.8 to 60 inches of rain annually, proper lot grading and well-maintained gutters belong on that list too.
How do seasonal weather changes in Panama City Beach impact short-term vacation rental income for investors?
Rental demand peaks during July and August when average highs are at 88.3°F. It dips in January - the coldest month, with highs averaging 60.1°F. If you're running the numbers on an investment property, that seasonal occupancy fluctuation needs to be in your model.
How does the coastal salt air and high humidity in Panama City Beach affect exterior home maintenance?
The combination of salt air and year-round relative humidity between 71% and 77% accelerates wear on exterior metals and paint faster than most buyers expect. Plan on washing exterior surfaces regularly and keeping outdoor HVAC compressors serviced to stay ahead of corrosion.
When is the best time of year to list a house in Panama City Beach, FL to avoid extreme weather disruptions?
Spring - specifically March - tends to work well. Average highs around 68.9°F make for comfortable showing conditions, and you're well clear of September, which carries the highest hurricane probability within the June 1 through November 30 Atlantic season.
Check out this article next